Seeing your data #2 - CAD integration
In the previous post, we looked at using Python libraries to convert spreadsheet data into charts.
In this post, we will be using Python (with no additional libraries) to visualise spreadsheet data in a CAD system (Rhino) by creating geometry from the data in the spreadsheet.
As with the previous post, the code for this is in our GitHub repo so you can copy it with ease.
Where we’re going
In this post we will walk through how to go from this

To this:

We will use Python code, running inside Rhino, to create geometry from the data in the weight estimate. If this is all new, perhaps check out our posts on the weight estimate and on coding as well.
Step 1
From Excel, export the spreadsheet as a CSV file. This makes it easier to read in Rhino without relying on external Python libraries to read the data.

Step 2
Open a new document in Rhino, and perhaps also take a look at Rhino’s developer documentation here. Particularly the part on editing scripts.
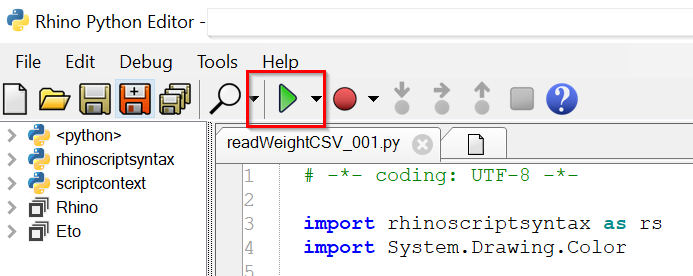
Edit a new ‘PythonScript’:

Step 3
Copy the code from GitHub into the window that appears.
[Side note on security: Copying and pasting code from the internet can be risky. It’s vital that you know what any code you use is doing, and be careful of any risks involved. Make sure the code does what it says and only what it says.]
What’s the code doing?
The code will read the contents of a CSV file defined at line 56:
filename = 'C:/Users/Public/code_example/weights.csv' # the name of the weights CSV file
First of all it defines two helper functions that are used to convert the text data it reads from the CSV file, fixString and convert.
Fixstring is needed when the CSV output includes commas placed within text quotes.
Convert is used to convert text data into numbers.
When Rhino runs the code, the ‘main’ function (line158) is called. This function tells rhino to
disable redrawing (which slows things down if you’ve thousands of items to draw)
read the weight file
re-enable redrawing.
In reading the weight file, the code has a ‘dictionary’ of colours that it assigns to items whose names (from column ‘A’ in the spreadsheet) match the names in the dictionary. Lines 63 to 66 define the item names that the code will look for, and their corresponding RGB colours. The actual assignment of the colours takes place in lines 131 - 134.
Starting at line 71, the code reads the file line by line, skipping the first (header) row.
For each line it:
Cleans up the data it read from the file and breaks it up into a list which corresponds to each cell from the spreadsheet (lines 76 - 77)
Reads the data from each cell (lines 84 - 91)
Creates a Rhino ‘box’ which will visually represent the weight item, centred at the item’s CG (lines 95-99)
The box is then scaled by the weight of the item. Editing the code at line 101 will change the weight-to-size characteristics of the box. Adjust to suit your needs.
The box is then expanded by moving its corners (lines 104-125)
Lines 128 and 129 add the box to Rhino’s data set, and names it.
Assigns a colour to the box as described above.
Assigns ‘userText’ to the box. This is a powerful way of storing your own data in Rhino objects. See below for more details. (lines 136 and following)
Places the box on an appropriate layer (line 143 and following)
…and then repeat this for all the lines in the file.
Step 4 - run the code
Once you’re satisfied that the code is safe, press the ‘run’ button.
Several things will happen…
Boxes will appear in the CAD model, indicating the location and weight of the items in the weight estimate:

For each box that gets created, ‘user text’ data will be added. Select one of the boxes and look at the ‘user text’ in the properties viewer:
This text shows the data from the spreadsheet, including the row in the spreadsheet from which the data came (you’ll appreciate this with big data sets!).

Layers will be created for each ‘Group’ defined in the ‘A’ column of the spreadsheet.
These new layers will be created under a layer called ‘weightsImport’, so they can be easily located and shown/hidden as needed.
To change the name of this layer, edit the code at line 59.

Extending the code
You can now add all kinds of bells and whistles to the code.
Try adding text dots to your geometry.
Add a leader with text to selected items in the model.
Perhaps add dimensions?
With a functional understanding of the tools, the possibilities for problem solving become vast. Enjoy :)
A note on debugging
Software rarely works correctly the first time. To help see what’s going on in the code, Rhino’s debugger is endlessly helpful. It allows you to halt the code (see ‘breakpoints’ here), check out what’s going on inside the code and work out what needs fixing.
Check out the documentation for more info.
The wrap
Again, the code for this is in our GitHub repo for your copying ease.
I hope this helps you. To comment on any of this or to find out more, hit the ‘contact’ page and get in touch.
Take care,
Nick.